 …and other lessons in #Dataviz were presented by our BU Datalabs team at the National Co-ordinating Centre for Public Engagement’s Engage 2015 event in Bristol last week. The annual Engage event brings together university leaders in public engagement from across the UK.
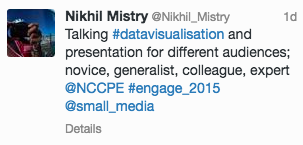
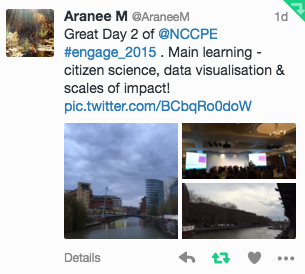
Tweets from @NCCPE #Engage_2015
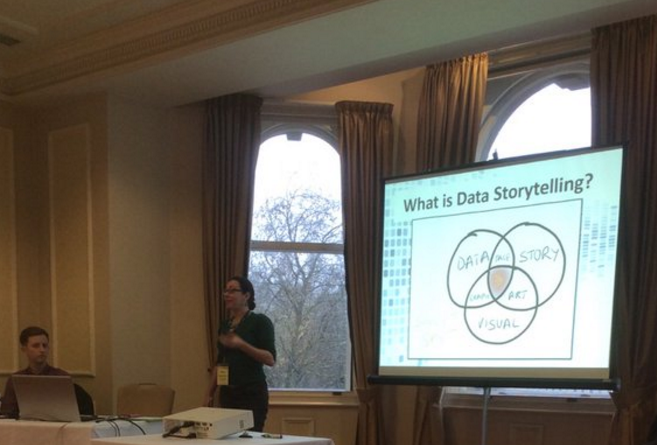
At Engage 2015 we focused on how data visualisations of research processes, findings and outputs can be created to reach different kinds of audiences. Stressing the importance of combining storytelling techniques, design principles and communication strategies into data visualisation, we designed two hands-on exercises for participants to put their public engagement expertise to work.
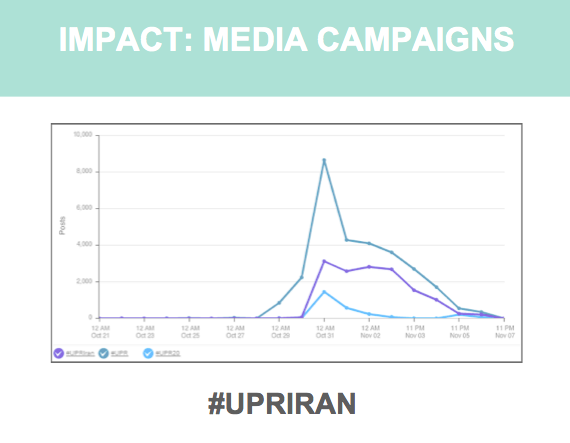
Surge in social media sharing @smallmedia
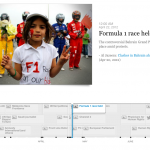
Sharing the ‘aesthetics of research’ with participants, James looked at how a data visualisation approach—when embedded throughout the research process from data gathering to research promotion—can increase public engagement and build pathways to impact. He noted that without data visualisation, there was little audience for this data on Iran’s human rights records, but after it’s re-imagining it as a data visualisation project, engagement soared.
 Datalabs 3: Digital Storytelling with Data
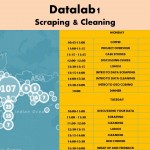 What do Wikileaks, MPs’ Expenses Scandals and Drone Strikes in Afghanistan have in common?
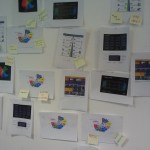 Where Numbers met Narratives: A Final Review of the BU Datalabs Fusion Project


 Poverty in the UK: book launch today at BU
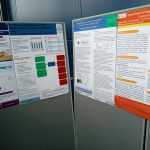 BU contributions to successful Global Health conference
 New paramedic science paper by BU’s Dr. Ursula Rolfe
 Congratulation on newly published systematic review
 Horizon Europe Cluster 3 (Civil Security for Society) 2026 Calls Now Open
 MSCA Doctoral Networks 2026 Call Information Webinar
 Reminder: Register for the ESRC Festival of Social Science 2026 Information Session
 ECR Funding Open Call: Research Culture & Community Grant – Apply now
 ERC Advanced Grant 2025 Webinar
 Update on UKRO services
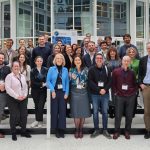 European research project exploring use of ‘virtual twins’ to better manage metabolic associated fatty liver disease