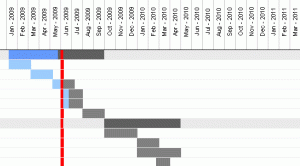
We owe the the Gantt chart to mechanical engineer, management consultant and industry advisor Henry Gantt (1861 – 1919). He developed his chart as a visual tool to show scheduled and actual progress of projects.
Like Henry, we too favour Gantt charts and like to see them in funding proposals. This is because a Gantt chart is an effective method of presenting to the funder a clear idea of:
- time-frame
- inputs
- key activities
- mapping of resources
How do you create a Gantt chart? The best advice we have seen is at the useful Research Whisperer blog, where they list 5 steps to creating your very own Gantt Chart in the post ‘How to make a simple Gantt chart’.
For more information about Gantt charts or to find out how RPRS can support your proposal development please contact Caroline O’Kane.







 National Postdoc Appreciation Week 2026: The Changing Landscape of Postdoc Careers
 NIHR Insight South West Central Conference 2026 at Bournemouth University
 BU PhD student presented at World Safety Conference in South Africa
 National Research Supervision Recognition: Apply Now & Join the Supporting Workshop on 16 September
 Horizon Europe Cluster 3 (Civil Security for Society) 2026 Calls Now Open
 MSCA Doctoral Networks 2026 Call Information Webinar
 ESRC Festival of Social Science 2026: Application Deadline Extended to Thursday 25 June 2026
 Reminder: Register for the ESRC Festival of Social Science 2026 Information Session
 ECR Funding Open Call: Research Culture & Community Grant – Apply now
 ERC Advanced Grant 2025 Webinar
 Update on UKRO services
 European research project exploring use of ‘virtual twins’ to better manage metabolic associated fatty liver disease
The Gantt IS good… very VERY good. Sometimes, they give too simplistic a perspective, but people DO love seeing them.