On Friday Steve Calver ended his latest MRG post with a question: “Does anybody read this blog?” – and within an hour a reader from another university replied to say “I do!“. Which is great! So I thought I’d share some of the visitor stats so you can get an idea of who views the blog and how regularly.
We measure footfall on the blog using the fabulous Google Analytics. The stats below are based on a period of 18 days during July and August 2011.
On average during this period the blog received 166 unique visitors every day, each spending approximately 2 minutes on the site.
51% of visitors find us via internet search engines. The top search terms led readers to our blog over the past 18 days are:
- bournemouth
- innovation
- bu research blog
- bournemouth university research blog
- security
- digital hub bournemouth university blog
- ict
- health
- hefce ref training information events
- marie curie fellowship 2011
- kip jones rufus stone
- bournemouth research blog
- transport
- bu logo
- racism
- bournemouth uk
- culture
- eurostat
- statistics
- wow effect
41% direct traffic, i.e. via the web address or via the BU Staff Portal. This is excellent as it shows that you lovely people who work at Bournemouth University are using the blog – hooray!
8% of visitors are referred to our blog by external sites. Our top referring sites are:
- Facebook (keep ‘liking’ our posts and share the BU love with your Facebook friends!)
- external BU website
- Research Fundamentals blog
- University of Lincoln Research Office Blog
- Christos Gatzidis’ blog
- Earlham College, USA
- Simmons College, USA (Open Access Directory)
The bottom two are interesting referrals as these are universities in the USA that have picked up on our new BU Open Access Publication Fund and promoted the idea via their own websites. This has then encouraged visitors to these sites to visit our blog.
At present 30% of visits to the blog are made by returning visitors and 70% are made by new visitors.
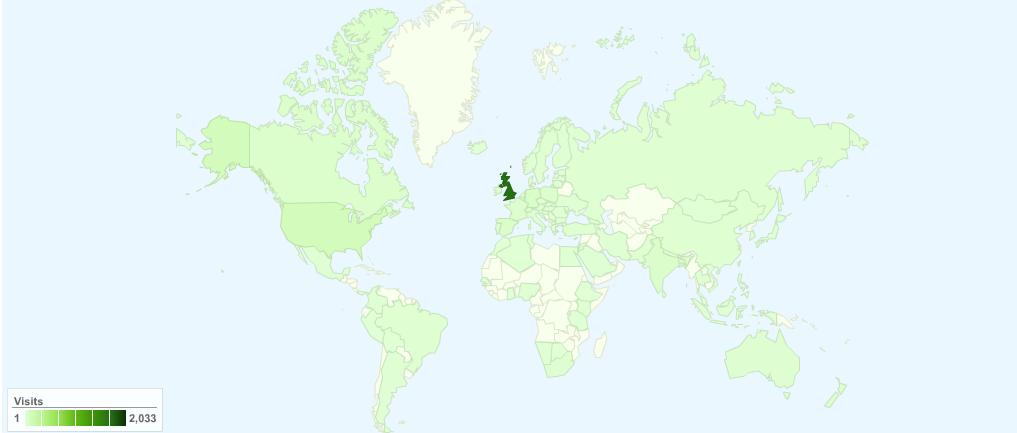
Our visitors to date have come from 91 different countries (as displayed in the map below). The top ten countries viewing the blog are:
- UK
- USA
- Germany
- Spain
- India
- France
- Poland
- Canada
- Belgium
- Italy
So why is all of this information important?
Because it shows us two important things:
1. That the blog is working internally as the main means of sharing research news and information!
2. That the blog is working externally to promote the excellent research undertaken at BU!
We’re always seeking to improve things so if you have your own webpages/blogs then please feel free to use them to promote the BU Research Blog or ask us to link to your webpages/blogs from this blog, and if you have any ideas on how to improve our blog and/or to increase readership then please let us know! 🙂


 Seeing the fruits of your labour in Bangladesh
 Exploring Embodied Research: Body Map Storytelling Workshop & Research Seminar
 Marking a Milestone: The Swash Channel Wreck Book Launch
 No access to BRIAN 5-6th February
 ECR Funding Open Call: Research Culture & Community Grant – Application Deadline Friday 12 December
 MSCA Postdoctoral Fellowships 2025 Call
 ERC Advanced Grant 2025 Webinar
 Update on UKRO services
 European research project exploring use of ‘virtual twins’ to better manage metabolic associated fatty liver disease
It’s good to see and hear you’re so widely read! Keep up the excellent work. Maybe we could do a joint poster or even session at the next ARMA conference about using social media in research support?
Hello, David! What a fantastic idea – we would be very interested in doing something with Lincoln at the next ARMA conference 🙂
Glad to see the link I have on my personal blog has generated traffic for this site.
You may want to consider adding a counter or something similar to the BU Research Blog in the immediate future, at the very least a total page views counter for example to offer an indication of traffic.
Great suggestion, Christos. I will see what we can do!
Good to hear, Julie. I’ll email you about it. What’s your email address?