We regularly monitor engagement with our award-winning BU Research Blog using the fabulous Google Analytics tool. Over the past year engagement has been incredible. The stats below are based on the period 11 September 2014 to 10 September 2015 (1 year).
On average during this period the blog received 76,659 unique visitors, each spending approximately 1.5 minutes on the site. The blog is generally much busier on weekdays attracting between 250 and 1,000 unique visitors each day. In total there have been almost 175,000 page views.
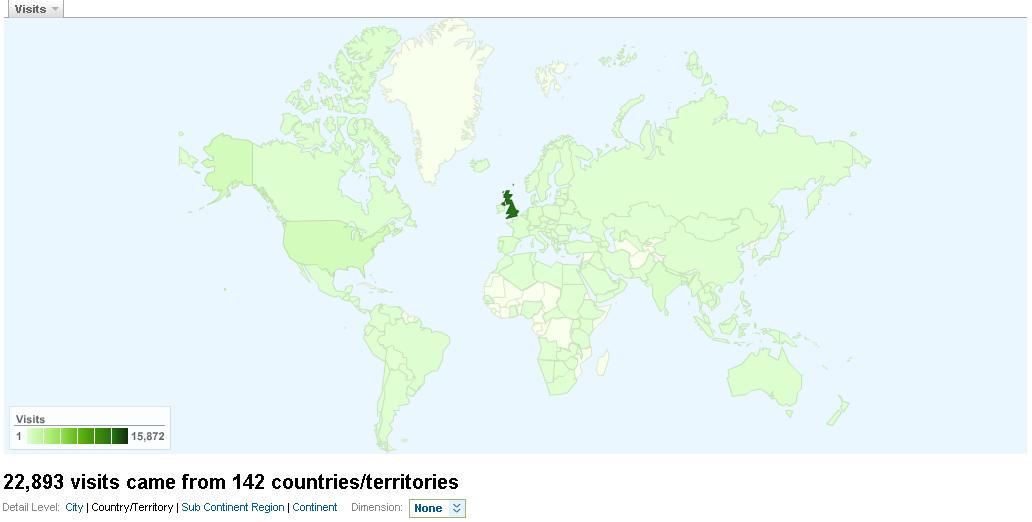
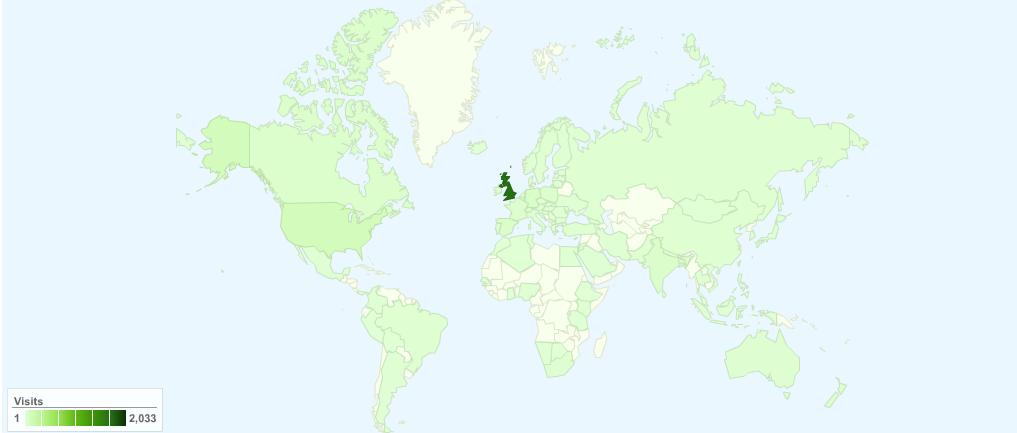
The majority of our visitors came, unsurprisingly, from the UK (64%) and over the past year we have received visits from people based in 192 different countries. After the UK, the next ten countries from which visitors most frequented the blog were:
- United States
- Philippines
- Germany
- India
- France
- Spain
- Australia
- Netherlands
- Canada
- Italy
Also unsurprisingly the majority of visitors came from Bournemouth and Poole (30.8%) indicating that the blog is alive and well among BU colleagues. The next ten UK cities from which visitors most frequented the blog were:
- London
- Southampton
- Birmingham
- Edinburgh
- Manchester
- Bristol
- Leeds
- Oxford
- Cambridge
- Sheffield
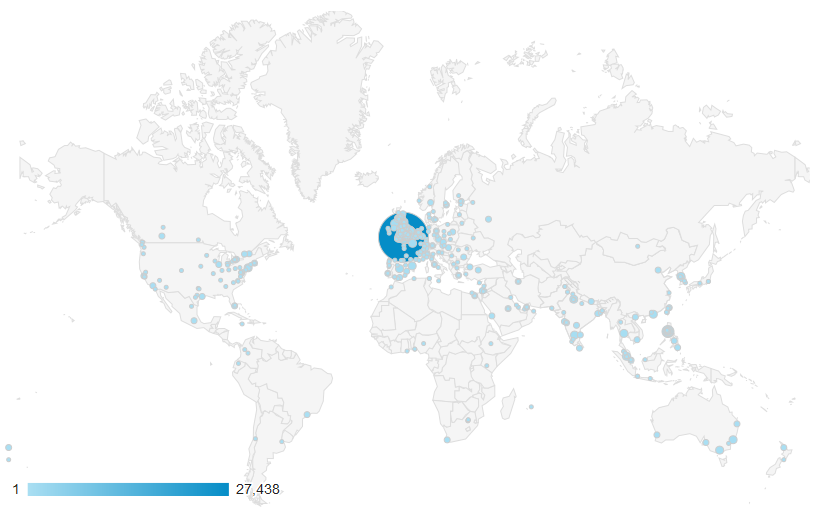
This map shows the locations of all the cities from where the blog has been accessed in the past year:

Approximately 60% of visitors find us via internet search engines. The top search terms that led readers to our blog over the past year are:
- sky
- poverty
- sport
- good luck
- research blog
- bu research blog
- environment
- help
- ref 2020
- usa
- transport
- bournemouth university research blog
- erasmus mundus fusion mobility
- professor matt bentley
33% of visitors are direct traffic, i.e. via the web address, the BU Staff Intranet, or the Daily Digest email. This is excellent as it shows that you lovely people who work at Bournemouth University are using the blog – hooray!
Over the year 35% (25%) of visits to the blog were made by returning visitors and 65% (75%) were made by new visitors (last year’s figures shown in brackets).
Of those who access the blog direct (i.e. mainly BU staff) the 10 most accessed pages last year were:
- Research ethics page
- Research Blog home page
- URA pages
- Writing a lay summary is easy, right?
- FoL proposals
- Thoughts on writing recommendations for a research thesis
- EU events clean sky info day and social innovation conference
- Want to gain a Marie Curie fellowship?
- Referencing Dutch, Flemish and German names in the Harvard system
- On academic writing
- BU International Open Access Week
- REF page
- Building a research team
- It’s only banter! Lad culture in university settings
- Leverhulme Trust visit 29 April
- Say it once, say it right – 7 strategies to improve your academic writing
- ORCID – have you got one?
- Research lifecycle
- RKEO thank you
- The REF results are in – BU’s research recognised as world leading
This is all excellent news. We’re always open to receiving feedback about the blog – please email us at any time with any comments, suggestions, etc, or add a comment to this blog post.
If you would like access to add your own stories and posts to the blog then email Rhyannan Hurst (rhurst@bournemouth.ac.uk) and she’ll get you started!


 Poverty in the UK: book launch today at BU
 BU contributions to successful Global Health conference
 New paramedic science paper by BU’s Dr. Ursula Rolfe
 Congratulation on newly published systematic review
 Horizon Europe Cluster 3 (Civil Security for Society) 2026 Calls Now Open
 MSCA Doctoral Networks 2026 Call Information Webinar
 Reminder: Register for the ESRC Festival of Social Science 2026 Information Session
 ECR Funding Open Call: Research Culture & Community Grant – Apply now
 ERC Advanced Grant 2025 Webinar
 Update on UKRO services
 European research project exploring use of ‘virtual twins’ to better manage metabolic associated fatty liver disease