I often wonder if other scientists wake up every morning to delete a deluge of spam messages from no-name journals and questionable conferences. Sometimes one of these emails will escape my extermination efforts and I end up reading it by accident. The invitations from so-called “predatory” publishers are so transparently fake and poorly written that a part of me finds their annoying overtures oddly amusing.
I realize that predatory publishing and phishing emails are not laughing matters. There has been an explosion of predatory publishers trying to con scientists out of their money. For a fee, these journals or books are just frothing at the mouth to publish your work collect your cash. Some may even invite you to serve on their “prestigious” editorial board, but this is just to lend an air of authenticity to their sham operation.
What separates a predatory publisher from a legitimate science publisher? Both charge you large sums of money for you to do all the work, but the latter employs a rigorous peer-review process that ensures the articles they publish have been properly vetted. Sting operations have revealed that predatory journals will publish absolute gibberish, proving they are phonies who just want to make fast cash. A recent sting operation involved the submission of a manuscript about midi-chlorians from Star Wars, written by Dr. Lucas McGeorge and Dr. Annette Kin. The fictional paper was accepted by four of these flimflam publications masquerading as a legitimate scientific journal.
In an effort to help root out some of these predatory publishers, I’ve compiled some of my favorite lines from the suspect emails I receive on a daily basis. I hope this helps people spot dubious publishers. The typos, spelling mistakes, and grammatical errors were left in place intentionally—exactly as they were sent to me. These types of errors represent a big red flag that a predatory publisher is stalking you. Please don’t take them as a sign that the PLOS editorial staff is sleeping on the job!
The Greeting That Proves They Have No Idea Who You Are
Fake journals will address you in unusual ways, or not at all! Some make no effort to conceal that they merely cut and paste your name into the slot of a form letter. Here are some examples I have received.
Dear Dr. WJ William J,
Dear ,
>Dear Dr.Jr WJ ,
Dear Dr. SULLIVAN,
Dear Dr. William J. Sullivan, Jr.1,2*,
Dear Dr. Jr,
Dear Dr. Jr William,
Dear Author,
Dear Researcher,
Dear Dr. Ferris (or someone else who is not me),
The opening is almost always followed by something like this:
“Greetings from the [PREDATORY] Journal!!!” or “Hope you are doing great!!” or “Hope our e-mail finds you well and in healthy mood.”
A New Type Of Sport: Extreme Flattery
Reading these emails can be a big boost to your ego, but keep in mind that thousands of others received the same exact praise. I’ve been called “esteemed,” “brilliant,” “magnificent,” and the “leader in the field.” I should show these emails to my mom; fake or not, she’d be very proud to see her son put on such a high pedestal.
They also make our work out to be the greatest thing since the microscope:
“It’s your eminence and reputation for quality of research and trustworthiness in the field of [insert a field that usually has no relationship to mine whatsoever] and for which you have been invited to become an honourable editorial board member.”
“I am impressed by your quality work and I really value your contribution towards recent work.”
“We have gone through your papers and find it is a wonderful resource for upcoming works.”
“It would be our honour and great fortune if you will share your manuscript.”
“It is our immense pleasure to invite you and your research allies to submit manuscript.” (I call all of my collaborators my Research Allies now, and warn everyone that if you’re not with us, you’re against us).
Some of the spam even tries to reassure you that it is not spam. Although I don’t doubt the last sentence (in bold).
“This is not a spam message, and has been sent to you because of your eminence in the field. If, however, you do not want to receive any email in future then reply us with the subject remove /opt-out. We are concern for your privacy.”
Smell the Desperation?
There is a palpable urgency in these invitations to get their hands on your work cash before someone else does…
“We consider Mini Reviews, Original Research/ Review Article, Case Reports, Short Communication, Conference Proceedings, Commentaries, Book Reviews etc.”
“[Our journal] publishes all kinds of papers in all areas of this field.”
“It is our immense pleasure to invite you to submit Research, Review, Mini review, Short commentary, Commentary, Case Reports, Methodologies, Systematic Reviews (or any type of article) for the upcoming issue of our journal.”
“We necessitate your plate of stuff in the frame of article.”
“We are in a deadly need of an article.”
The Closing That Is Too Close For Comfort
Emails from predatory publishers often close with more friendly compliments, with the hope that you will continue to provide them a constant research revenue stream…
“We look forward to a close and lasting scientific relationship for the benefit of scientific community.”
“Anticipating for a positive response!”
“Thank you and have a great day doctor!”
“Our journey is effectively heading.” (whatever that means)
And here are some of the more amusing ways they describe my anticipated work:
“We await your adorable paper.”
“Your paper will serve as a wave maker.”
“We aspire you also to be a significant part of our team by publishing your magnificent article.”
And one that is just plain baffling:
“For future anticipation to reach out scientific community we want your support towards the success of Journal.”
They may even try to get you to do their dirty work for them. I take the following sentence to mean that they want me to spread the word about their predatory journal and invite my colleagues to be suckered into submitting work to them as well:
“As this is an invited submission request, you can also suggest your colleagues.”
Some Final Warning Signs
Be wary of any inaugural issues or invitations that ask you to submit your paper through an email address.
These predatory publishers may also try to give you a false sense of the importance of their “journal.” One of these invitations boasted that “email newsletters are being circulated to 90,000+ subscribers.” All this tells me is that 89,999 other people received their unsolicited spam.
I’ve also noticed they are often willing to discount their publication fees if you send them something – “anything at all” – within seven to ten days. No legitimate journal expects you to whip up a quality article in that short a time.
Oh, and one more thing: many of these emails have an excessive number of exclamation points!!!
I hope that you are now better equipped to catch a predator. If you still aren’t sure if your email invitation describes a bona fide journal or not, you can check Beall’s List of Predatory Journals and Publishers or see if the journal is indexed on PubMed. Here’s hoping that you don’t get fooled!!!
Originally posted on the 4th October 2017 – https://blogs.plos.org/scicomm/2017/10/04/to-catch-a-predatory-publisher. Reposted here with permission.
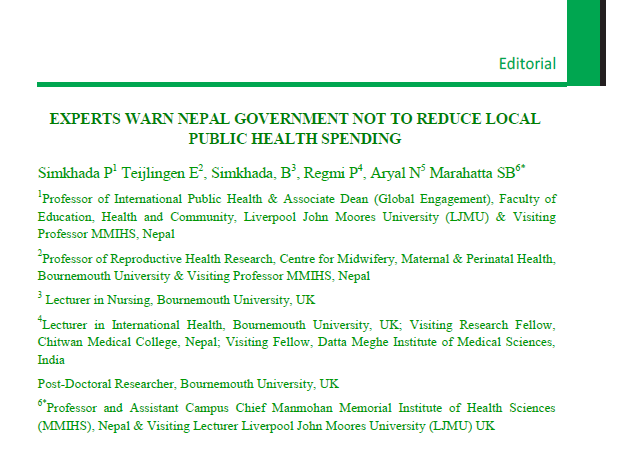 The editorial warns about the risks of losing the focus on public health and its wider national and global perspective in the recently changed political arena of Nepal. Since 2015 Nepal has moved from a central state to a federal republic, whereby the seven new Provinces have gained much more power and control in the decentralisation process. Moreover the first local elections for two decades in 2017 meant a lot of new and inexperienced local politicians were voted in. Many of these local people had little prior experience of political processes, governing health systems, the notion of priority setting, running sub-committees of elected representatives, political decision-making at local level, etc. The paper argues that Public Health can easily disappear of the radar. The untrained newly elected representatives with no political experience are most likely to be drawn into proposing and supporting popular measures including developing new buildings, black-top roads, hospitals, etc., rather than measures that increase the local or regional budget for teachers, Continuous Professional Development (CPD) for community health workers, and preventative public health measures in general. Buildings and roads are immediate demonstration to voters that politicians have done something useful, reducing maternal mortality by 2.6% or employing two additional health workers doesn’t give politicians neither the same publicity, nor do such policies have immediate signs of success, and hence are unlikely to be vote winners.
 BU has an agreement with Springer which enables its authors to publish articles open access in one of the Springer Open Choice journals at no additional cost.


 On 4 September 2018, 11 national research funding organisations, with the support of the European Commission including the European Research Council (ERC), announced the launch of cOAlition S, an initiative to make full and immediate Open Access to research publications a reality. It is built around Plan S, which consists of one target and 10 principles.





 Congratulations to current and past academics in the Faculty of Health & Social Sciences and the Faculty of Science & Technology who contributed to the newly published


 Fourth INRC Symposium: From Clinical Applications to Neuro-Inspired Computation
 ESRC Festival of Social Science 2025 – Reflecting back and looking ahead to 2026
 3C Event: Research Culture, Community & Cookies – Tuesday 13 January 10-11am
 Dr. Chloe Casey on Sky News
 Final Bournemouth University publication of 2025
 ECR Funding Open Call: Research Culture & Community Grant – Application Deadline Friday 12 December
 MSCA Postdoctoral Fellowships 2025 Call
 ERC Advanced Grant 2025 Webinar
 Horizon Europe Work Programme 2025 Published
 Update on UKRO services
 European research project exploring use of ‘virtual twins’ to better manage metabolic associated fatty liver disease