The political to and fro this week has been whiplash-inducing and the Universities Minister job is vacant – again.
Brexit & Parliament
Unfortunately the Universities Minister job is beginning to resemble that of the Hogwarts Defence against the Dark Arts teacher – in a shock announcement on Thursday Jo Johnson resigned as Universities Minister and announced he would be stepping down as a MP in the next election.
Given his views on Brexit it wasn’t really a surprise (it was more of a surprise that he took the job at all) but the timing was dramatic. He said:
“In recent weeks I’ve been torn between family loyalty and the national interest – it’s an unresolvable tension & time for others to take on my roles as MP & Minister”. He announced his resignation through Twitter and it received 17,000 likes (presumably as support for his principled decision) within hours.
Following Jo’s resignation the Spectator and Evening Standard published a 2013 older quote in which Boris criticised Ed Miliband for competing against his brother for the Labour leadership: ‘Only a socialist could do that to his brother, only a socialist could regard familial ties as being so trivial as to shaft his own brother.’ [Spectator]
UUK have said it is unlikely the government will appoint a replacement universities minister because of the likelihood of a general election in the near future. It is expected that Education Secretary Gavin Williamson and Children and Families Minister Kemi Badenoch will cover the brief in the immediate future.
NUS issued a statement responding to Jo’s resignation: “Jo Johnson’s resignation identifies the inability of our current governing structures in the higher education sector to improve the lives of students, as well as how disruptive Brexit negotiations have been to all parts of our society. The next Minister will be the fourth in under a year and these constant changes from Westminster do not provide the continuity that students need to get on and reform education in the UK. A no deal Brexit would be disastrous for students, who bear the burden of an education system that is in crisis. At the NUS, we will continue to critically engage with decision makers in Westminster to resist the damage that a no deal Brexit will have on our members and advocate for structural change to our entire education system.”
Jo’s departure creates a lot of uncertainty for the sector, as there are many live issues in HE, including subject level TEF and Dame Shirley’s review and the Augar Review. Of course we are wondering who will eventually take over the position and become the fifth HE minister in under two years. There’s not a lot of experience of the role left in the Commons now – of all the HE minsters in the last 9 years only one remains as a Conservative MP.
Jo Johnson, alongside Nick Gibb (Minister for School Standards) were the only Education experienced Ministers within the Department for Education. We could of course be in for more changes in the next two months.
Ministers linked to education and HE have not had a good week: Justine Greening, Greg Clark, Sam Gyimah were all expelled from the Conservative Party for voting against the Government whip this week. Here is the list of all 21 ousted MPs. Furthermore, 30 MPs have said they will stand down as MPs and not contest the next election (16 Conservative, 12 Labour, 2 Lib Dem) including some big names. See the list and their reasons for leaving politics here.
In other parliamentary news –
- Michelle Donelan has been appointed as an unpaid Parliamentary Under-Secretary of State, Department for Education, as maternity cover for Kemi Badenoch MP (Minister for Children and Families).
- Graham Brady has been reinstated as Chair of the 1922 Committee (until the start of the next parliamentary session).
What’s going to happen next
The House of Lords have finalised the Hilary Benn Bill that requires the PM to ask for an extension to Article 50 if he has not finalised a deal that Parliament can support by 19th October. It was not amended and will now receive Royal Assent and become law.
The government will propose another motion under the Fixed Term Parliaments Act on Monday asking Parliament to agree to holding a general election. The opposition parties have agreed to oppose it or abstain. Under the Act, it needs 434 votes in support to be approved. Unless the government tries a different route, this means that there cannot be an election in October. The other possibility is that they try to pass a law allowing one, but given that they do not have a majority, it is unlikely that this would pass.
Parliament will be suspended (prorogued) for 5 weeks at some point next week.
At the time of writing this, the PM is still saying he will not ask for an extension to Article 50, despite the law that has been passed. It is hard to see how he can avoid doing so unless he resigns. Unless of course he negotiates a deal in the next few weeks and it is approved by Parliament.
If there is an extension, then there is likely to be an election after that, probably before Christmas. And someone will then have to sort out what happens when the extension expires. It is of course very possible that lots of things will happen before the end of October and this could all change several times before then.
Spending Round 2019
Chancellor, Sajid Javid, announced departmental budges during a controversial parliamentary session where he was told off several times by the Speaker for electioneering. In short the spending announcement, termed an infrastructure revolution, covered a one year period and it seems the government are expecting to be awash with cash for police, health, social care, schools, prisons, and places of worship. Dods have produced a comprehensive briefing on it here including reaction from sector stakeholder bodies The Education and Skills section starts on pages 17-18. FE and apprenticeships are also mentioned under the Business section on pages 19-20.
Just a few key points:
Health & Research
- Increase to the Health Education England (HEE) budget, including
- an additional £150 million for Continuing Professional Development
- providing a £1,000 central training budget over three years for each nurse, midwife and allied health professional, as well as increased funding for wider education and training budgets to support delivery of the NHS Long Term Plan
- The Government is committed to increasing levels of research and development (R&D) to at least 2.4% of GDP by 2027. In the autumn, the government will set out plans to significantly boost public R&D funding, provide greater long-term certainty to the scientific community, and accelerate its ambition to reach 2.4% of GDP
- £250m of investment in artificial intelligence from 2020-21 and discovering preventative solutions to issues such as cancer.
Education
- Schools got a three year funding settlement, however, this is situated within the changing face of the education sector:
- These announcements come at a time of significant upheaval within the education system.
The Government’s response to Augar and consultations on Level 3, 4&5 courses are all still outstanding.
Whilst today’s announcements will go some way towards alleviating anxiety over school budgets, the Government have their work cut out in aligning and resourcing employer led standards across, apprenticeships, T-levels and Higher Technical Qualifications. Such efforts will be integral to assuaging broader concerns over skills shortages post-Brexit.
- £400m investment in Further Education in 2020-21
- includes £190m to increase core funding for 16-19- year-olds;
- £210m of funding in targeted interventions such as high-cost programmes, English and Maths resits, T Levels, the Advanced Maths Premium and workforce investments.
- No mention of HE.
Stakeholder reaction to Education announcements
- The National Education Union commented that the Spending Review saw a “major shift in Government policy”. However, also warned that spending was still “significantly short of what is required”.
- The NAHT has the Chancellor’s commitment to further education spending, claiming it as a “big win” and that it will go “some way to restoring the real-terms cuts”. But emphasised that “gaps still remain” and that “we need to work with the government to make sure the money goes where it is most needed”.
- The Sixth Form Colleges Association has welcomed the £400million investment in 16 to 19 education and is a foundation upon which to build.
- The Association of School and College Leaders has welcomed the money promised by the government, but noted that “even with this additional funding there will still be a shortfall” in education funding.
Student Voter Registration
Earlier this week the Government intended to push for 15 October general election, however political developments seem to have temporarily postponed this (for now, at least). Unless the EU wave a magic wand and a Brexit deal is reached in time for a 31 October exit then a general election at some point late in 2019 remains a very likely possibility.
In Theresa May’s snap 2017 election, there was a widely held belief that young voters had made a huge difference to the results (since largely discredited). In fact a Times article claims a source within Boris’ campaign team has admitted that an advantage of the proposed 15 October election date meant it would limit the numbers of students who register to vote (because the voting registration deadline would have be 27 September).
No matter when (if) the election is held it is important that BU and SUBU play a full role in ensuring students register to vote at their new address. A staggering number of people have registered to vote recently – The Times report that 70,000 under 35’s registered to vote within the last two days.
No doubt, whatever the outcome and whenever the election takes place, the student vote will be closely analysed post-election. For example, in Northampton the Conservative majority is 807 and there are 900 students within new halls of residence.
This is the online link to register to vote.
Soft Power
HEPI have published The soft-power benefits of educating the world’s leaders which details how the UK is falling behind the US in the soft power statistics. Soft power is the eventual influence experienced by educating a person from another country within the UK. The individual receives a positive UK HE experience and considers the UK favourably when they return to work in a leadership position within their own country. HEPI state:
Two years ago, the UK had educated one more serving world leader (58) than the US (57). Today, there is one more serving world leader educated in the UK (59) than back in 2017 but there are three more who were educated in the US (62). Over the same period, the number of world leaders who were educated in France has increased from 34 to 40.
Nick Hillman, Director of HEPI and a co-author of the report, said:
- “The soft power that the UK has historically accrued through educating so many of the world’s leaders is extraordinary. It is rivalled only by the US, which is of course far larger. But it cannot be taken for granted. In recent years, the UK has slipped behind the US while the third placed country, France, has made great strides. Moreover, as the UK struggles to find its new place in the world, it may need to rely on the potential benefits from soft power even more than in the past.
- Given that the UK’s international student numbers have flatlined in recent years while countries like Australia have been forging ahead, this won’t be easy. Our survey of world leaders provides yet more evidence of the need for a more positive approach towards international students than has been taken over the last decade.”
Tom Huxley, the report researcher, said: “Britain’s higher education sector has, in the past, been the most attractive on the planet for those who go on to lead their own countries. But the growth of US influence in this ranking is striking. US institutions have educated more of today’s world leaders than we have. If recent trends continue, there is a risk that, over time, it could diminish the standing of our universities.”
Access and Success – white working class boys
THE ran an article suggesting digital technology could support universities’ diversity and help bridge the gap in attracting disenfranchised social groups: Reaching invisible students: white working-class boys.
- Our work in this area has shown us the potential for digital technology to significantly encourage better student inclusivity, via a combination of effective information delivery and reducing psychosocial barriers to entry.
- One of the key barriers for young white working-class men is their lack of confidence that university life is for them. With accents, clothing and lifestyles that may be very different from their more affluent peers, it is hard for them to imagine themselves fitting in.
- This is where digital tech can be a great benefit. An online chat event set up by a university can specifically target this group while they are still at school, enabling them to see and hear from those a few years ahead of them and with a similar background. We know that during this key information-gathering stage, it can be a significant advantage to working-class young men to be able to ask questions anonymously and to listen to the questions of other people in the same position as them.
- At the same time, this kind of online platform can address financial worries by including someone on the student finance team to explain any bursaries or scholarships available, or the availability of part-time jobs in the area – perhaps again drawing on the experience of other working-class students who have supported themselves financially.
- Chatbots can also be useful here… Because chatbots are non-judgemental and unbiased, they can help teens at least familiarise themselves with the jargon, tackle some of their initial worries and gradually build their confidence.
- There is potential for this group of men to be invited to online events throughout their university life, offering extra support and helping to minimise the risk of dropping out. These events could also help men to think about future careers and raise their confidence at tackling interviews, recruitment tests and the social aspects of networking.
- Universities already plough large investments into outreach and support. But by embracing digital tech platforms, they are going where teenage boys spend time already, potentially attracting them into an academic environment that, although initially alien, could prove to be the making of them.
The article references NEON’s Working Class Heroes report from Feb 2019.
Catching up
You can catch up on our summer updates here. Highlights include Sarah writing about the Impact of Post Qualification Admissions on WP students and a review of the responses to the KEF consultation (from page 5).
Parliamentary Questions
Mental Health
Q – Jo Stevens (Cardiff Central): To ask the Secretary of State for Education, what steps the Office for Students has taken since its establishment to assess the adequacy of provision of mental health services and student support at universities.
A – Joseph Johnson:
- In our latest guidance to the Office for Students (OfS), we asked that it continue its work to support student experience, with a focus on wellbeing and mental health.
- Where a provider has significant gaps in outcomes between students with a declared mental health condition and their peers, the OfS require providers to set out an ambitious strategy to narrow these gaps and promote equality of opportunity, as part of their access and participation plans.
- The OfS also regulates at a sector level to share evidence and examples of effective and innovative practice. On 5 June 2019, the OfS announced the award of almost £6 million for 10 large-scale projects through a challenge competition, encouraging higher education providers to find new ways of combating student mental health issues. The OfS has commissioned a programme-level evaluation to gather what works most effectively and to disseminate learning across the sector.
- On 17 June 2019, the government announced a £1 million fund for a further OfS challenge competition to find innovative proposals that drive improvements in mental health support for higher education students.
Student grants
Q – Angela Rayner: To ask the Secretary of State for Education, whether it is his policy to reintroduce maintenance grants for students from low and middle income backgrounds in higher education.
and
Q – Angela Rayner: if he will make it his policy to implement the recommendations of the Augar Review
A – Joseph Johnson:
- As part of our ongoing review of Post-18 Education and Funding, the government will be considering Philip Augar’s recommendations carefully. The government has not yet taken decisions with regards to the recommendations put forward.
- Students from the lowest-income families have access to the largest ever amounts of cash-in-hand support for their living costs. The government has announced a further 2.9% increase to maximum grants and loans for the 2020/21 academic year.
- (Same answer to both questions.)
STEM
Q – Andrew Percy: To ask the Secretary of State for Education, what steps his Department is taking to encourage more working class young people to take up STEM subjects at university . [282286]
A – Joseph Johnson:
- To maintain a dynamic and growing economy, the government is committed to tackling science, technology, engineering and mathematics (STEM) skills shortages. The department is encouraging more students into STEM education and training, at all stages, from primary school to higher education (HE).
- To support more students to take STEM subjects at university, the government has increased investment in maths and digital subjects within schools, including a new post-16 maths premium and a new £84 million programme to improve the teaching of computing. Both of these initiatives aim to increase the number of young people taking these subjects, from all backgrounds.
- This school-level investment programme is complemented by increasing efforts from the university sector to encourage more disadvantaged students to enter HE. The Office for Students (as the regulator for HE in England) has a duty to promote equality of opportunity in relation to access and participation in HE. In 2018, 18 year olds from disadvantaged backgrounds were proportionally 52% more likely to enter full-time HE than in 2009.
Q – Stephen Morgan: To ask the Secretary of State for Education, what assessment he has made of the effect on funding for STEM subjects at higher education institutions of the UK leaving the EU without a deal.
A – Gavin Williamson:
- Part of the teaching grant funding that the government provides to eligible higher education (HE) providers, via the Office for Students, is allocated to support the provision of high-cost subjects, including science, technology, engineering and mathematics (STEM) subjects. We do not expect this funding arrangement to change as a result of Brexit .
- We do not expect any significant short-term increase in the vulnerability of HE providers to financial failure as a result of no deal EU Exit. The income shock from EU exit, deal or otherwise, is expected to be ‘manageable’, and any effect will not lead to a cliff-edge.
- Department for Education officials engage regularly with HE institutions in relation to HE funding and the provision of high-priority courses such as STEM, as well as on EU Exit.
Universities: Apprentices
Q – Paul Farrelly: To ask the Secretary of State for Education, what steps his Department and the Education and Skills Funding Agency are taking to support universities to work closely with non-levy-paying small and medium-sized enterprises .
A – Kemi Badenoch:
- The department and the Education and Skills Funding Agency continue to encourage universities to work with employers, including non-levy-paying small and medium-sized enterprises (SMEs). The Degree Apprenticeship Development Fund (DADF) has focussed on building collaborative projects between providers and employers; including non-levy-paying SMEs . DADF has funded additional engagement activities to better understand their needs.
- Birmingham City University, University of Greenwich and Aston University have actively engaged with SMEs as part of DADF-funded projects.
- Over the course of the next year, all employers will be able to control how they pay for their apprenticeship training and assess and recruit their apprentices via the apprenticeship service. This will allow non-levy paying SMEs to work closely with a greater number of high-quality training providers, including universities.
Q – Paul Farrelly: To ask the Secretary of State for Education, what steps the Government is taking to ensure that degree apprenticeships support (a) social mobility and (b) lifelong learning among underrepresented groups.
A – Kemi Badenoch:
- Apprenticeships benefit people of all ages and backgrounds, offering high quality on and off-the-job training. Level 6+ and degree apprenticeships offer people an alternative to full time university, as well as the opportunity to upskill or re-train throughout their lives.
- The Degree Apprenticeship Development Fund (DADF) aims to enable and encourage greater social mobility and widen participation. The DADF has supported 103 higher education (HE) providers and has resulted in 4,464 degree apprentice starts. The Office for Students has published an evaluation of the fund.
- HE providers, such as universities, can include degree apprenticeships in their Access and Participation Plans; these set out how they will support underrepresented groups and help individuals from disadvantaged backgrounds access and succeed in HE. The National Apprenticeship Service works with local partners to ensure that apprenticeships at all levels are available in disadvantaged areas.
- We are running an employer engagement campaign, ‘Opportunities through Apprenticeships ’, working with partners in Portsmouth, Nottingham, South Tyneside and Torbay. It aims to support social mobility by creating opportunities for more apprentices from disadvantaged areas to undertake high value apprenticeships with higher earnings potential and progression, such as degree apprenticeships
Electoral Register: Students
Q – Chris Ruane: To ask the Minister for the Cabinet Office, what assessment he has made of the potential merits of (a) the University of Sheffield ‘s initiative on voter registration for students and (b) mandating universities to promote students to register to vote.
A – Kevin Foster:
- The Government is encouraged by the University of Sheffield ’s experience but has no plans to mandate a single approach across the country.
- The Government is, however, committed to ensuring the electoral registration system is responsive to the needs of students. Ministerial Guidance was issued to the Office for Students (OfS) in February 2018 acting on a commitment made in Parliament during the passage of the Higher Education and Research Act (2017), directing that they require Higher Education providers to comply with Electoral Registration Officer (ERO) requests for data and they be encouraged to work with Local Authorities to promote electoral registration amongst their student populations. The merits of working closely with EROs have been demonstrated by a number of Higher Education providers across the country.
- Yet, the Government does not believe that one size fits all and instead favours an approach which allows innovation.
- The Ministerial Guidance has since been used by the OfS to produce their own guidance to Higher Education providers, which advises them how they might best implement, and abide by, the requirements placed on them. The OfS guidance came into force in August. The Government is committed to ensuring everyone who is eligible to register to vote is able to do so and, in 2014, introduced online registration for the first time. Statistics show young people aged between 14 and 24 are more likely than average to use this as a means of registering to vote.
- The Government believes these measures will drive up the number of applications to register from students – improving both the completeness and accuracy of the electoral register – as well as further improve the relationships between Higher Education provider and Local Authorities.
Nursing: Training
Q – Graham P Jones: To ask the Secretary of State for Health and Social Care, whether the additional funding for the NHS announced by the Prime Minister will be used to increase the number of nursing bursaries.
A – Chris Skidmore:
- The education funding reforms announced in the 2015 Spending Review started to take effect from August 2017 and pre-registration nursing students began to access student loans rather than receiving a National Health Service bursary.
- In January 2019, the NHS published its Long Term Plan which sets out a 10 year vision for healthcare in England . The NHS Interim People Plan, published on 3 June, sets out the immediate actions needed to grow the nursing workforce across all settings by over 40,000 in the next five years.
- We will work with the NHS and the Higher Education Institution sector to improve awareness of the financial support packages available to all undergraduate and postgraduate healthcare students and how they can be accessed.
Students: Disadvantaged
Q – Angela Rayner: To ask the Secretary of State for Education, what assessment he has made of the potential merits of a student premium for funding (a) further and (b) higher education.
A – Kemi Badenoch:
- The government is determined to ensure disadvantaged students are supported in their post-16 education. The national funding formula for 16-19-year olds and the funding through the Adult Education Budget both include a disadvantage uplift. This provides extra funding for disadvantaged students and learners, specifically for those with low prior attainment, or those who live in the most disadvantaged areas.
- The government teaching grant funding to the higher education (HE) sector includes 3 student premium allocations that support: full-time students deemed to be at risk of discontinuing their studies; part-time students; and disabled students. All HE providers in the approved (fee cap) category of the Office for Students register are eligible to receive these student premium allocations, including further education college ’s offering HE.
Q – Cat Smith: To ask the Secretary of State for Digital, Culture, Media and Sport, with reference to the announcement of 27 February 2019 that new youth voice projects will be launched to encourage young people to participate in making national policy, what policies will be prioritised for youth participation; and what steps she will take to ensure the work and influence of the projects is transparent.
A – Nicky Morgan:
Three new youth voice projects were announced in February to encourage young people to participate in making national policy:
– Youth Steering Group
– Young Inspectors Group
– Digital Youth engagement research
The Youth Steering Group has already been involved in discussing the Government’s future offer for young people and the review of the guidance which sets out the statutory duty placed on local authorities to provide appropriate local youth services. The Department for the Environment Food and Rural Affairs and the Department for Business, Energy and Industrial Strategy invited the Youth Steering Group to conduct a review of environment and climate policy. Young people are also contributing to policy development on serious violence through the Government’s Youth Advisory Forum on Serious Violence .
The Young Inspectors Group are participating in the monitoring and evaluation of national programmes affecting young people.
The Digital Youth Engagement research explored how new digital solutions can enable large numbers of young people to play a role in consultations and policy design across government.
We will make further announcements on these pioneering Youth Voice projects in due course
Research
UK Research and Innovation has published its vision for how it will promote world-leading research and innovation that is built on the knowledge and values of society and open to people from all backgrounds. Its four goals are to:
- Focus on under-represented communities and places
- Actively involve people in their work
- Inspire and empower young people
- Listen to and understand public concerns and aspirations
The goals will be delivered through funding calls, commissioning research and analysis, and piloting new approaches. The vision was launched in conjunction with UKRI’s first public engagement funding call for universities and community partners to test new ways to collaborate on research and innovation with under-represented communities.
Special Educational Needs
The Government have announced a ‘major review’ into support for children with special educational needs, seeking to build on the 2014 reforms. The review comes a week after the Government announced a funding boost of £700m in 2020/21 for pupils with the most complex needs.
Education, Health and Care Plans, launched in 2014, were designed to deliver tailored support to children and young people aged 0-25 with the most complex special education needs. The new review will look at how the system has evolved since then, how it can be optimised for families, and how to ensure quality provision is delivered across the country. It will also explore the role of health care in SEND in collaboration with the DHSC.
The review will look at and put forward new actions on:
- The evidence on how the system can provide the highest quality support that enables children and young people with SEND to thrive and prepare for adulthood, including employment
- Helping parents to make decisions about what kind of support will be best for their child
- Making sure support in different local areas is consistent, joined up across health, care and education services, and that high-quality health and education support is available across the country
- How to strike the right balance of state-funded provision across inclusive mainstream and specialist places
- Aligning incentives and accountability for schools, colleges and local authorities to make sure they provide the best possible support for children and young people with SEND
- Understanding what is behind the rise in education, health and care (EHC) plans and the role of specific health conditions in driving demand
- Ensuring that public money is spent in an efficient, effective and sustainable manner, placing a premium on securing high quality outcomes for those children and young people who need additional support the most.
Education Secretary Gavin Williamson said: Our reforms in 2014 gave vital support to more children, but we know there have been problems in delivering the changes that we all want to see. So it’s the right time to take stock of our system and make sure the excellence we want to see as a result of our changes is the norm for every child and their families.
Minister for Care Caroline Dinenage said: The support and care for people with special educational needs and disabilities is one of my top priorities. The SEND review will be crucial in widening our knowledge of the parts of the system which are working well and the areas which need improvement. The Department for Health and Social Care will play a key role in the review so we can ensure that high quality healthcare support is available for all throughout the country.
Secretary of State for Work and Pensions Amber Rudd said: Children with special needs and disabilities need to get the right educational support and health care so they can thrive. This review will help make sure all families get the support they need so every child, young person and their parents feel extremely positive about their future.
MPs have repeatedly raised concerns over the number of timeliness of completed EHCPs, with it being reported that only 24% were completed in the statutory time limit in the Secretary of State’s own constituency. Nationally, only 3% of children in England have SEND statements or EHCPs. The Government contend that, owing to the introduction of EHCPs more than 350,000 children and young people aged 0-25 with the most complex special educational needs are receiving the tailored support they need to thrive and receive a world-class education. Of those in schools around half (130,000) are continuing in mainstream education.
T-levels
The DfE have published a policy update as a compendium to their T-level action plan. Key Points:
Grading and Certification:
The T Level Certificate will include:
- an overall grade for the T Level, shown as Pass, Merit, Distinction or Distinction
- a separate grade for the core component, using A* to E
- a separate grade for each occupational specialism studied, shown as Pass, Merit or Distinction
- confirmation that the minimum requirements for maths and English qualifications have been met
- confirmation that the industry placement has been successfully completed
- confirmation that any additional mandatory requirements have been met
A T Level Distinction grade is only awarded to students who, as well as meeting the other T Level requirements, have achieved an A* in the core and a Distinction in their occupational specialism (or Distinction on aggregate if more than one occupational specialism is studied).
UCAS Tariff Points:
- To support progression into higher education, UCAS tariff points will be allocated to T Levels. Points will be allocated to overall T Level grades, not to separate elements of the T Level. This is to recognise the value of the T Level programme as a whole. Students must achieve at least an overall Pass grade or higher in order to receive UCAS points.
- The size and rigour of a T Level programme is comparable to a 3 A Level programme. Therefore, T Levels will attract UCAS points in line with those allocated to 3 A Levels.
- Although the T Level programme is broadly the same size as a 3 A level programme, the qualifications have different purposes. The T Level programme is intended to help students develop the knowledge and technical skills required for skilled employment. T Levels and A Levels therefore measure different abilities, using different grading scales.
- A T Level Pass grade is allocated a tariff score of either 72 or 96 points: where a student has obtained an overall Pass by achieving a Pass in the occupational specialism and a B or C in the core, a tariff of 96 UCAS points. Where a student has obtained an overall Pass by achieving a Pass in the occupational specialism and a D or E in the core, a tariff of 72 UCAS points.
- The tariff points allocated to overall Merit and Distinction T Level grades represent even increments between the points allocated to an overall Pass (with a C or above in the core component) and Distinction* grade.
Despite the allocation of UCAS points to T-levels, the policy paper twice emphasises that the qualifications are predominantly designed to deliver a direct route into skilled employment, given the industry placement inherent in the qualification. It also lacks detail how the qualifications will feed into Level 4 & 5 Higher Technical Education (HTE), currently under review by the Government. In the HTE consultation the Government emphasise the importance aligning of employer-led standards across apprenticeships, T Levels and HTQs. They also state their desire that HTE be a prestigious choice for those completing T-levels.
Consultations
Click here to view the updated consultation tracker. Email us on policy@bournemouth.ac.uk if you’d like to contribute to any of the current consultations.
New responses this week:
Other news
New Towns Fund: Bournemouth is on a (short) list of 100 towns eligible to receive funding if they successfully work with Government to develop innovative regeneration plans. The Government announcement states:
- The towns eligible for support from the £3.6 billion Towns Fund include places with proud industrial and economic heritage but have not always benefitted from economic growth in the same way as more prosperous areas.
- Communities, businesses and local leaders will now join forces to draw up ambitious plans to transform their town’s economic growth prospects with a focus on improved transport, broadband connectivity, skills and culture.
- Today’s announcement follows the Prime Minister’s confirmation in July of an additional £1.325 billion to support towns as part of a renewed vision to level up our regions, which took the total value of the Towns Fund to £3.6 billion.
- The government will soon publish a prospectus to guide towns through the process and set eligibility criteria for funding.
- Once approved, new Town Deals will improve connectivity, provide vital social and cultural infrastructure and boost growth – with communities having a say on how the money is spent.
Here is the full list of eligible towns.
Migration: Research Professional report on the Office for National Statistics who have announced inaccuracies in their non-EU migration figures (overestimation) due to inaccurate international student data.
Student Loans: The SLC has issued top tips for actions students should take to ensure they receive their maintenance loans on time. Meanwhile £28 million pounds worth of overpaid student loan contributions still hasn’t been able to be returned to the students who are due a refund. The SLC has written to the students who overpaid but £28 million remains unclaimed. Research Professional have the detail here.
Commuting: A Government news story highlights how the gender pay gap is exacerbated by reluctance to undertake a longer commute despite a higher salary.
Subscribe!
To subscribe to the weekly policy update simply email policy@bournemouth.ac.uk
JANE FORSTER | SARAH CARTER
Policy Advisor Policy & Public Affairs Officer
Follow: @PolicyBU on Twitter | policy@bournemouth.ac.uk
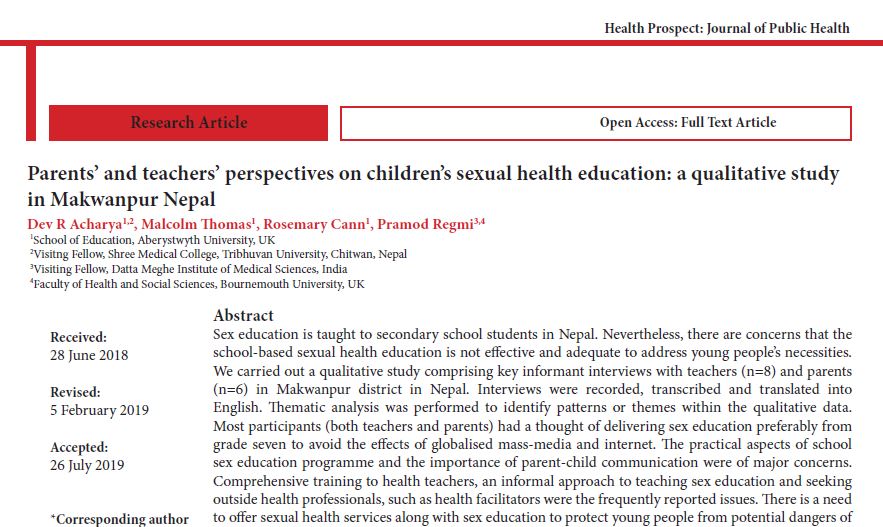
 Congratulations to FHSS’s Dr. Pramod Regmi on the publication of his recent qualitative paper ‘Parents’ and teachers’ perspectives on children’s sexual health education: a qualitative study in Makwanpur Nepal’ [1]. The paper is co-authored by colleagues from Aberystwyth University.
 The European Commission maintains a large number of publicly available databases with details about Horizon 2020 and other EU projects. The UK Research Office (UKRO) have recently prepared a summary of sources where data related to both submitted and funded EU projects may be found; these may be useful for academics considering applying for EU funding and searching for experienced partners for future applications.
 CORDIS


 At Bournemouth University we collaborate with global institutions and organisations through our education, research and practice.



 The second wave of UK Research and Innovation’s (UKRI) Fund for International Collaboration (FIC) has been announced on Friday 9 August 2019. The Fund for International Collaboration aims to enhance the UK’s excellence in research and innovation through global engagement, forging new bilateral and multilateral research and innovation programmes with global partners.
 Announcement also contains summaries of the FIC Wave 1 projects funded through the UKRI-JSPS call.





 Seeing the fruits of your labour in Bangladesh
 Exploring Embodied Research: Body Map Storytelling Workshop & Research Seminar
 Marking a Milestone: The Swash Channel Wreck Book Launch
 No access to BRIAN 5-6th February
 ECR Funding Open Call: Research Culture & Community Grant – Application Deadline Friday 12 December
 MSCA Postdoctoral Fellowships 2025 Call
 ERC Advanced Grant 2025 Webinar
 Update on UKRO services
 European research project exploring use of ‘virtual twins’ to better manage metabolic associated fatty liver disease